The Histogram is one of the most useful tools on your camera once you understand how it works. This simple graph can give you a good deal of information about the picture you just took, especially when outdoors and your LCD screen is hard to see clearly. The histogram is also one of the most widely misunderstood features of your camera, but this article will help you to understand how to interpret what it is telling you.
What is a histogram?
A histogram is basically a bar graph that displays how much of something occurs at certain intervals. For example, you could create a histogram showing the number of phone calls you receive each day during a week:
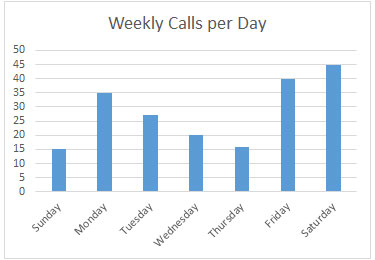
Sunday: 15
Monday: 35
Tuesday: 27
Wednesday: 20
Thursday: 16
Friday: 40
Saturday: 45
So what does this have to do with Photography? When you capture an image, your camera records the amount of light at each pixel on a scale of 0-255. Zero represents black and 255 represent white. Each number between represents a varying shade of gray. The histogram shows how many pixels are recorded in each tonal range by varying the height of the graph at that color range. The more “Dark” pixels you have, the higher the graph will be on the left, and if you have a lot of “light” pixels the graph will be higher on the right.
In the following example the upper-right diagonal is 50% gray and the lower-left diagonal is a gradient from black (0) to white (255). Across the very bottom are 16 shades of black to white:

Now look at the histogram for the above image. Note the spikes correspond to the labeled areas in the above image:
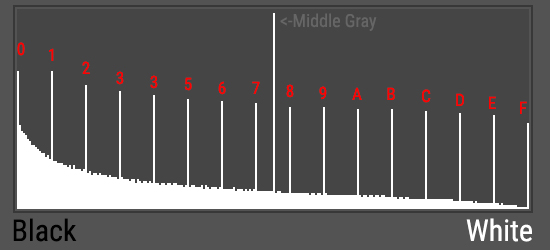
If you look carefully at the image you will notice that there are more blacks than whites and that is reflected in the histogram. The Graph gradually decreases as you look from left (black) to right (white).
Why is the Histogram important?
You may have noticed that reviewing images on your tiny LCD screen can be difficult, especially in bright sunlight. The Histogram gives you a way to tell at a quick glance where your overall exposure falls relative to the dynamic range of your digital camera’s ability to capture tonal ranges. Many a photographer has checked the image in the field and thought it looked great only to find when they got home that it was darker or brighter than they thought and now it is too late to fix it (although many try using Photoshop or Lightroom). The best fix is to get it right in the field and exposure is still very important, even though we have some flexibility in post. If you try to brighten a dark image too much you will start to see noise in your images. Images that are too bright will have a loss of detail in the brightest regions and no amount of adjustment in the computer can recover that lost detail.
Two types of Histograms
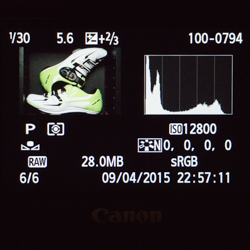
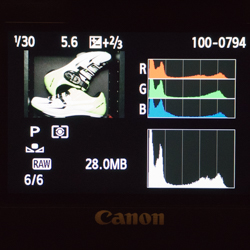
Most digital cameras give you the option to select if you want to view the “Luminosity” or the “color channel” histogram. The luminosity histogram will display an overall reading of your image, as if it was shot in black and white. This is helpful for most scenes, but there are times when shooting a scene that a specific color might clip or blow out before anything else and the color channel histogram can help you to notice those better. the color channel histogram shows a histogram for each of the 3 colors your camera records. Yes, it’s true that your camera only records 3 colors: Red, Green and Blue. There is a special filter that resides over your sensor called the “Bayer Matrix Array”. Each row alternates between red and green filters on one row and the next row alternates between green and blue filters. Then using the Bayer algorithm the camera looks at each pixel, and the surrounding pixels to calculate the actual color of that pixel. This is similar to how your computer monitor, LCD and Plasma TV’s work – they only display those 3 colors, but by varying the intensity of each pixel, coupled with the color of the neighboring pixel we view the full range of colors.
So What is a “Normal” Histogram?
There is no such thing as a “normal” histogram – the histogram will vary depending on the type of image, subject, tonality and exposure settings you choose. However, there are 4 common types of images that you use to decide if your histogram is correct.
High Contrast
High contrast images have a lot of contrast between the brightest and the darkest regions. These types of images also pose the greatest challenge for our digital cameras. The human eye can see detail in a range of darkest to brightest details equivalent to approximately 10-14 stops, but a digital SLR camera can only record a range of about 8-11 stops. A “Stop” in photography refers to a halving or doubling the amount of light. As a result, in a high contrast scene it is possible that you will see areas that are completely black or completely white in your images, but when you looked with your eyes you saw detail in those scenes. A high contrast scene will typically have a graph that extends over the entire range. See the following example:

Notice how the graph extends over the full range of the histogram from dark to light:
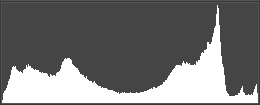
You can see that the graph is pretty even throughout the histogram with a few spikes, but no major spikes right up against the left or right side of the histogram. This is the “ideal” way to expose most of the images we capture, but note the following other image types.
Low Contrast
Low contrast scenes are scenes that typically do not have very dark or very bright regions and will typically be centered in the histogram:
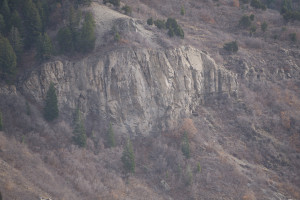
This photo was taken on an overcast day with a fair amount of haze in the atmosphere. Notice how the graph does not fill the entire histogram, but only a small portion of it near the middle:

High Key
High Key is a variation on the Low contrast where the image is overall very bright and as a result the graph will be tallest on the right side of the histogram:

One of the most common “high Key” images are portraits on a white background like this. Notice how the graph is mostly near the right of the Histogram:

Low Key
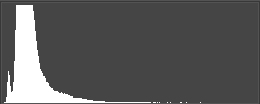
Low key is the opposite of high key and the graph will be tallest on the left side of the histogram:
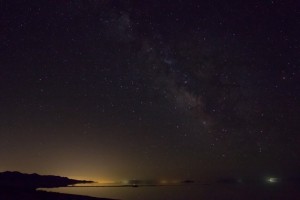
Night time or any dark subject is a common low key photo situation (and one of my favorites). Notice how the graph is very high on the right side of the histogram, but not all the way to the right:
Blinking Highlights – Your Histogram’s Best Friend
I love blinking highlights (and blinking shadows in cameras that have them). Blinking highlights are another visual confirmation that an area of your image has been recorded as white, with very little or no detail being captured. On Canon cameras, once this is enabled the blinking highlights are visible when you review your image, no matter which detail screen you are on. I typically keep my camera review set to display the image, shooting data and histogram. On Nikon Cameras the Highlights need to be enabled in the menu, then you toggle through the various views to see them. You will see the word “highlights” blinking the corner of your LCD, and if there is any areas flashing the warning they will blink with the word. On sony cameras the highlight warning is automatically displayed on the same screen as the histogram, and most Sony cameras now show blinking shadows as well. If I am taking a picture of a scene and something important is blinking, I immediately know that I need to make an adjustment and reshoot. If something unimportant is blinking, I might still make an adjustment since our eyes are typically drawn to the brightest part of the scene, and if a large part of my scene is blinking I know that the viewer may miss what I want them to see since they will be drawn away from that.
Expose to the Right
Exposing to the Right or ETTR is a method in which we adjust our exposure so that the graph is as close to the right of the Histogram as possible without actually bunching up to the right and losing highlight detail. For the following photograph, I used the ETTR method to get my exposure right so that when I returned home to my digital darkroom I could work my magic:

This photo looks terrible straight out of the camera. the sky is too bright and the shadows are way to dark, but by reviewing the histogram I knew that I had an image I could then work with in Lightroom later:
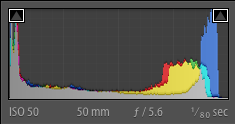
I was able to brighten the shadows and darken the highlights as well as some other changes:

I have written an article on post processing, be sure to read it for more information.
Use the Histogram to Determine if You Really Need HDR
HDR stands for “High Dynamic Range” in photography. As mentioned previously, our digital cameras can’t record as much visual light range as we can see. HDR is a way for us to combine multiple images of varying exposure to retain the highlight and shadow detail we originally saw. By glancing at your histogram you can tell immediately if the image you just shot is a candidate for HDR if you find that a mid exposure has your graph pushed all the way to the left and the right sides – this tells you that you are losing both shadow and highlight detail.
Do You Shoot in RAW?
You may have noticed that the histogram represents the tonal range from 0-255, which is an 8-bit image file. If you are shooting in RAW you are actually recording 12-14 bits in a 16-bit space, which means that you have more data than the histogram shows. Check out my RAW vs JPG Real World Example Article for a real world difference between RAW and Jpeg files. For most cameras if you are shooting in raw the histogram is not a fully accurate representation of your exposure since it is based off the embedded JPEG image based on your camera settings. When shooting in raw you typically have about 2/3 of a stop to perhaps a full stop more highlight detail being recorded than the histogram and blinking highlights will show. Since highlights are so critical this is something I wish the camera manufacturers would address, but until they do you need to be aware of this detail.
Conclusion
I hope this article helps you to understand your histogram and realize what a powerful tool it is. Until I could afford a DSLR this is a feature that I wish my film camera offered. It would have saved me a lot of incorrect exposures. One feature I really like on my A6000 is that I can preview the histogram in my viewfinder. When shooting I can tell if my exposure will be correct before I shoot, rather than after. Take some time to look at your histogram and try some different shooting situations to see how your histogram reacts under different circumstances. Try using exposure compensation and underexpose then overexpose the same image and compare the histogram. Getting to know how it works will help you to become a better photographer.

